The extreme solar flare on September 1st, 1859 remains the ultimate benchmark for extreme space weather. The brilliant ribbons of light snaking through a gargantuan sunspot group, spotted independently by British astronomers Richard Carrington and Richard Hodgson, were the first solar flare ever observed. Less than 24 hours later the world was engulfed in geomagnetic turmoil unlike anything seen before. Telegraph networks went haywire, sparking fires and zapping operators. Magnetographs went off scale. Tropical skies glowed with bright aurora.
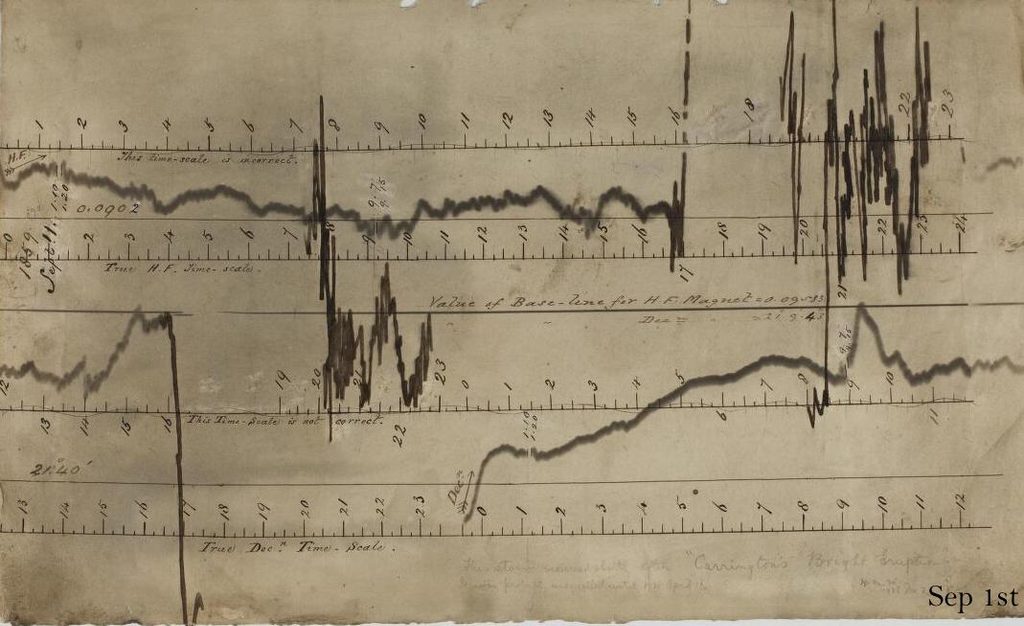
Greenwich Observatory (London) magnetogram on September 1st, 1859 showing extremely disturbed conditions. Image: British Geological Survey.
Why we need to know how big the flare was
The extreme solar flare spotted by Carrington and Hodgson launched an extreme coronal mass ejection towards the Earth. Its impact with our magnetic field triggered quite possibly the most intense geomagnetic storm in centuries. We need to know just how big this solar flare was in order to estimate how often it may occur and at how much risk our modern society is from its impacts.
A long-standing estimate for the Carrington flare was ~X45 (e.g. Cliver & Dietrich, 2013). A giant flare, an order of magnitude more powerful than the more frequent single-digit X-class flares. Recent review of data through multiple approaches and methods has resulted in the estimate being revised upward. Significantly.
Total area and brightness of the flare
One way of estimating its size is by working backward from white-light observations. That is exactly what Hayakawa and coauthors did in 2023. They measured the approximate area of the flare from Carrington’s drawing, estimated its surface brightness and arrived at a total energy output. The result: ~X80 (range X46-X126).
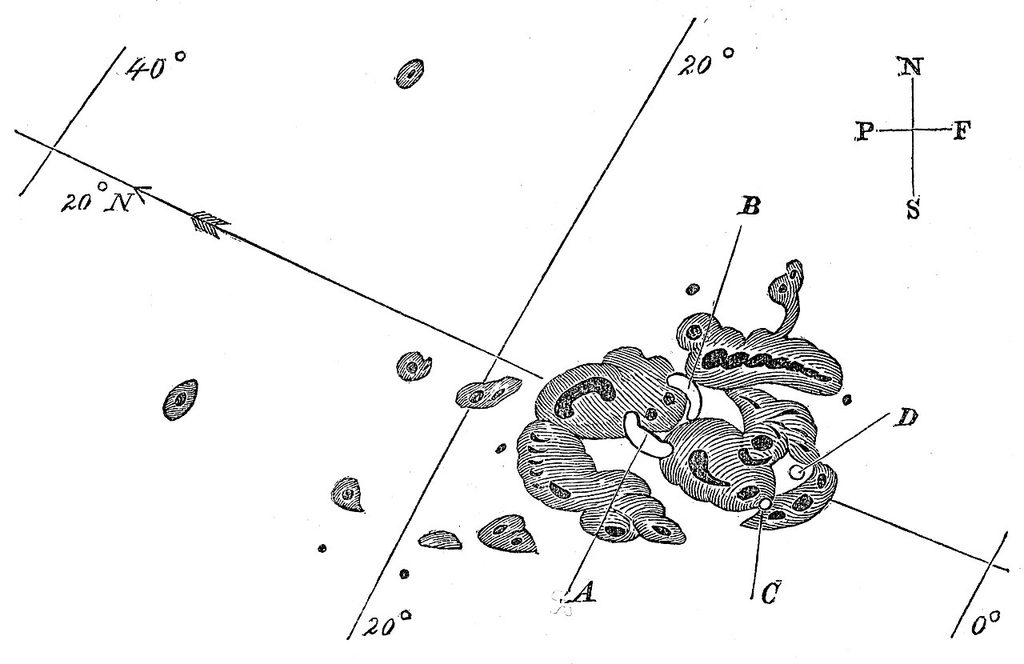
The intense solar flare on September 1st, 1859 drawn by Richard Carrington. The flare is visible as brilliant points and ribbons of light marked A, B, C, and D. Ribbons A and B were visible first and transitioned to points C and D in approximately 5 minutes, and then disappeared.
Ionospheric disturbance (the “magnetic crochet”)
Another way of estimating the size of the flare is by the geomagnetic solar flare effects, also known as the ‘magnetic crochet’. A solar flare releases a massive burst of extreme ultraviolet and X-ray radiation. It causes strong ionization of D and F regions of the ionosphere (60-150 km altitude), flooding it with free electrons. The sudden increase in conductivity causes the naturally occurring currents on the dayside to surge. The surging currents generate their own magnetic field, which registers on ground-based magnetometers as a sudden spike.
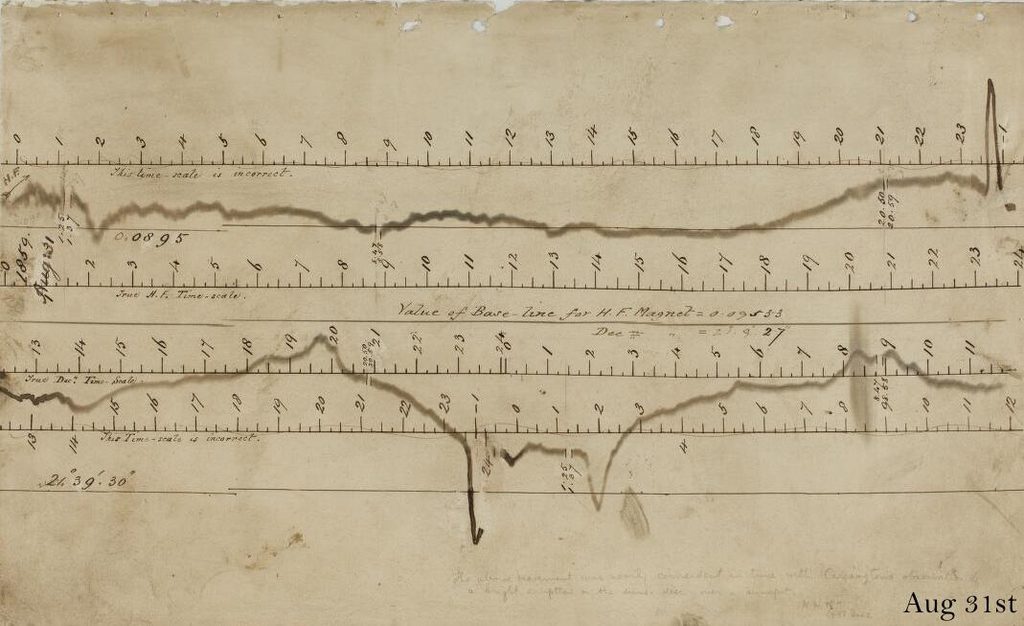
Greenwich Observatory (London) magnetogram on August 31st, 1859 showing the ‘magnetic crochet’ or SFE: the spike on the upper magnetogram recorded at 23:15 (actually at 11:15 UTC). Image: British Geological Survey.
A strong magnetic crochet (solar flare effect – SFE) was recorded during the Carrington flare. Using the digitized records of the Carrington flare SFE and comparing them with SFEs of recent, lesser, but well recorded X-class flares, Hudson et al. (2025) estimate the Carrington flare was an ~X105 event (range X81-X146).
Sunspot area upper bound
Another way of estimating the maximum possible flare size is through the active region total area. The total magnetic flux available to fuel a flare scales with the area of an active region. The larger the region, the larger the total magnetic flux. Using this relationship and some assumptions about the magnetic field density and the reconnection fraction, a broad estimate of maximum flare intensity can be made. For the Carrington flare a recent estimate from the total active region area is ~X36. The range extends up to ~X240 uncertainties in magnetic field density.
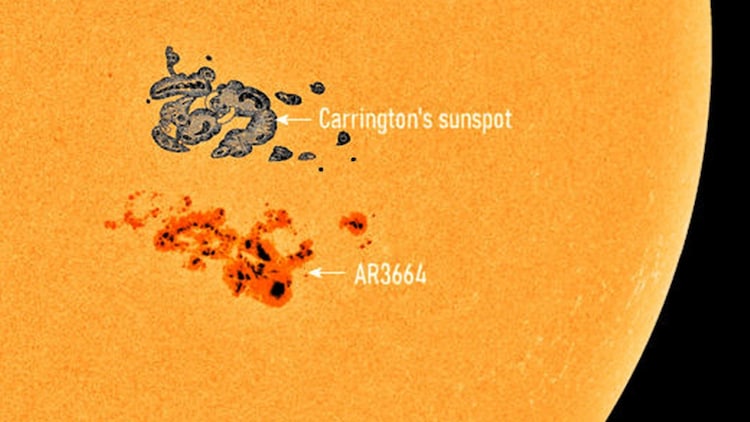
Carrington’s sunspot group compared with the 2024 giant AR 3664. Image credit: Spaceweather.com.
How frequent are Carrington-level solar flares?
The recent revised estimates are right on the triple-digit X-class flare threshold. That is significantly stronger than the largest reliably observed solar flare of the Space Age, the November 4th, 2003 X40-X45 event (Hudson et al., 2024). And far stronger than the two enormous flares during the 2003 Halloween storms, peaking at X24.6+ and X14.3.
It is possible to get an idea of how frequent Carrington-level solar flares are by studying how frequently lesser flares occur. Extending the distribution of smaller flares towards larger flares indicates how frequent they may be (Gopalswamy, 2018; Cliver et al., 2022). There is very little data to confirm these estimates, but it appears a 100-year flare might be around ~X50 and a 1000-year flare might be just above ~X100.
Pushing the Carrington flare into the ~X80-X105 range moves it from a once-in-a-century event to once-in-a-millenium superflare. However, these estimates are highly uncertain. Were we really lucky enough to have seen a 100-year flare in the last 23 years? And a 1000-year flare in just the last 167 years? There are hints that very large flares may occur on the Sun more frequently than the current regressions, and exponential and power law models predict.
Regardless, the Carrington flare stands as a historic benchmark for severe space weather and as the event all others are measured against. In 1859 its impact was limited to telegraph wires and brilliant night skies. But today, in a world utterly dependent on technology that is vulnerable to extreme space weather, it is the Big One we really need to worry about.